Coronavirus Outbreak
Re: Coronavirus Outbreak
There is an XLSX with all the data. the graph was generated directly from that.
0 x
-
Ken
- Posts: 21863
- Joined: Thu Jun 13, 2019 12:02 am
- Location: Washington State
- Affiliation: former MCUSA
Re: Coronavirus Outbreak
There are thousands of lines of data in that spreadsheet spread across 13 different tabs. What did you do, just pick two numbers that looked good and seemed to prove your point and used those to make your graph?
Because the spreadsheet I am looking at shows an age-standardized mortality rate of 863 per 100,000 person years for the unvaccinated and an age-standardized mortality rate of 64.5 for people ever vaccinated. That is a 13-times higher death rate for the unvaccinated and more or less in line with the CDC's data for the US.
See?
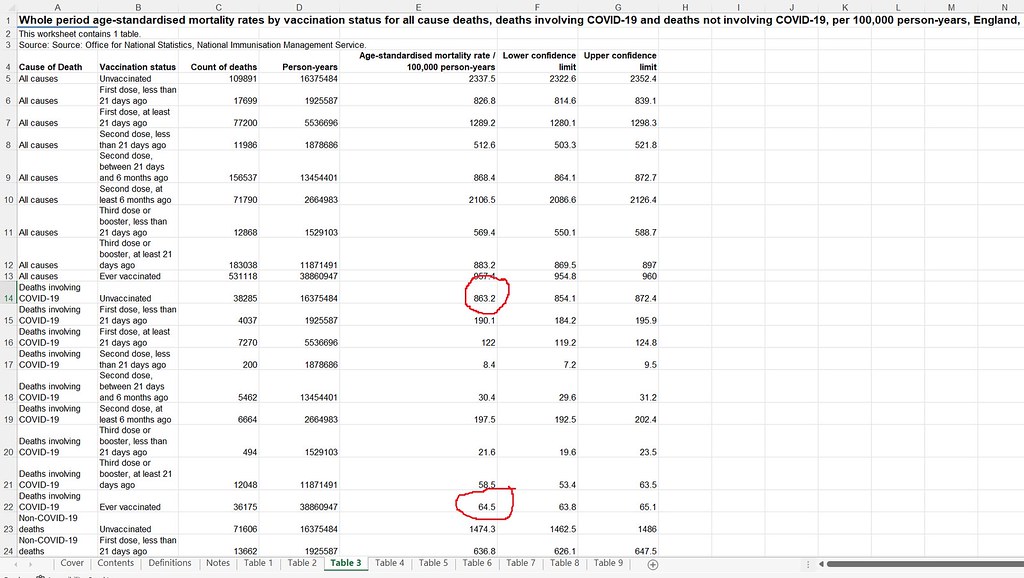
Source: https://www.ons.gov.uk/peoplepopulation ... tusengland
0 x
A fool can throw out more questions than a wise man can answer. -RZehr
Re: Coronavirus Outbreak
You're looking at whole period data. which is the same problem as the Canadian data you posted. It's always skewed.Ken wrote: ↑Mon Jul 18, 2022 8:54 pmThere are thousands of lines of data in that spreadsheet spread across 13 different tabs. What did you do, just pick two numbers that looked good and seemed to prove your point and used those to make your graph?
Because the spreadsheet I am looking at shows an age-standardized mortality rate of 863 per 100,000 person years for the unvaccinated and an age-standardized mortality rate of 64.5 for people ever vaccinated. That is a 13-times higher death rate for the unvaccinated and more or less in line with the CDC's data for the US.
See?
Source: https://www.ons.gov.uk/peoplepopulation ... tusengland
0 x
-
Ken
- Posts: 21863
- Joined: Thu Jun 13, 2019 12:02 am
- Location: Washington State
- Affiliation: former MCUSA
Re: Coronavirus Outbreak
So to get the result you want you have to cherry pick just one or two months of data that seemingly prove your point? Even though you are just showing raw numbers and not mortality rates?
In fact, if we look at just the months of April and May 2022 and look at the age-standardized mortality rates for those months they show substantially higher mortality rates for unvaccinated than vaccinated.
April 2022: 202.4 for unvaccinated and 96.5 for vaccinated or over 2-times higher death rates for unvaccinated.
May 2022: 77.6 for unvaccinated and 35.5 for vaccinated, again over 2-time higher death rates for unvaccinated.
Here, take a look, right from table 1 of the spreadsheet. You conveniently ignored this information when you made your graph. I highlighted the relevant rows and circled the mortality rate figures.
Is there some reason you chose not to graph these?

0 x
A fool can throw out more questions than a wise man can answer. -RZehr
Re: Coronavirus Outbreak
Looking at the most recent data, and observing the trend is not cherry picking. Cherry picking is looking at whole period data that includes 1+ year when vaccinations were not available.Ken wrote: ↑Mon Jul 18, 2022 11:40 pmSo to get the result you want you have to cherry pick just one or two months of data that seemingly prove your point? Even though you are just showing raw numbers and not mortality rates?
In fact, if we look at just the months of April and May 2022 and look at the age-standardized mortality rates for those months they show substantially higher mortality rates for unvaccinated than vaccinated.
April 2022: 202.4 for unvaccinated and 96.5 for vaccinated or over 2-times higher death rates for unvaccinated.
May 2022: 77.6 for unvaccinated and 35.5 for vaccinated, again over 2-time higher death rates for unvaccinated.
Here, take a look, right from table 1 of the spreadsheet. You conveniently ignored this information when you made your graph. I highlighted the relevant rows and circled the mortality rate figures.
Is there some reason you chose not to graph these?
Look at the data, and the trend for non-boosted. That is despite discarding the first 21 days after a dose. on a 6 month booster schedule, that's throwing out 9% of your sample. When you start making those kinds of compromises, you can make the data say whatever you want. but it's obvious what's going on.
I think the booster benefit can be explained with nothing but the 21 day exemption, although I can't find any data to prove that. A major reason I think that, is because the 21 data is intentionally not tracked, so I assume they're hiding something.
Would you agree with this statement. 2 dose vaccination (ie: non boosted) now has higher case rate, mortality, and hospitalization?
0 x
-
Ken
- Posts: 21863
- Joined: Thu Jun 13, 2019 12:02 am
- Location: Washington State
- Affiliation: former MCUSA
Re: Coronavirus Outbreak
That is why you should look at longer-term trends and larger population aggregates and not just one month. Especially if you are parsing the data into such small categories where random variation can affect results. I mean, sure, I would agree that for one month the data show that the non-boosted have a higher death rate. But we are talking about just 16 deaths which likely isn't a large enough sample size to have confidence about the results. And that is why the aggregate data posted previously is more informative. In fact the confidence limits between that number and the unvaccinated death rates overlap so statistically you can't reliably say that one is actually higher than the other.nett wrote: ↑Tue Jul 19, 2022 10:32 amLook at the data, and the trend for non-boosted. That is despite discarding the first 21 days after a dose. on a 6 month booster schedule, that's throwing out 9% of your sample. When you start making those kinds of compromises, you can make the data say whatever you want. but it's obvious what's going on.
I think the booster benefit can be explained with nothing but the 21 day exemption, although I can't find any data to prove that. A major reason I think that, is because the 21 data is intentionally not tracked, so I assume they're hiding something.
Would you agree with this statement. 2 dose vaccination (ie: non boosted) now has higher case rate, mortality, and hospitalization?
0 x
A fool can throw out more questions than a wise man can answer. -RZehr
Re: Coronavirus Outbreak
There is a trend forming, and it's going the wrong way. Specifically, it's going the direction that skeptical mRNA experts specifically warned about.Ken wrote: ↑Tue Jul 19, 2022 12:08 pmThat is why you should look at longer-term trends and larger population aggregates and not just one month. Especially if you are parsing the data into such small categories where random variation can affect results. I mean, sure, I would agree that for one month the data show that the non-boosted have a higher death rate. But we are talking about just 16 deaths which likely isn't a large enough sample size to have confidence about the results. And that is why the aggregate data posted previously is more informative. In fact the confidence limits between that number and the unvaccinated death rates overlap so statistically you can't reliably say that one is actually higher than the other.nett wrote: ↑Tue Jul 19, 2022 10:32 amLook at the data, and the trend for non-boosted. That is despite discarding the first 21 days after a dose. on a 6 month booster schedule, that's throwing out 9% of your sample. When you start making those kinds of compromises, you can make the data say whatever you want. but it's obvious what's going on.
I think the booster benefit can be explained with nothing but the 21 day exemption, although I can't find any data to prove that. A major reason I think that, is because the 21 data is intentionally not tracked, so I assume they're hiding something.
Would you agree with this statement. 2 dose vaccination (ie: non boosted) now has higher case rate, mortality, and hospitalization?
There is also the all-cause mortality concern that the UK is experiencing. Something is seriously wrong.
0 x
-
Ken
- Posts: 21863
- Joined: Thu Jun 13, 2019 12:02 am
- Location: Washington State
- Affiliation: former MCUSA
Re: Coronavirus Outbreak
Actually we are talking about a month (May 2022) in which COVID mortality was rapidly declining across the board in the UK because the spread of the Omicron variant was rapidly abating. This pandemic comes in waves or surges. And picking just one month when deaths across the board are rapidly dropping is not going to give you meaningful trends. In other words, are death rates dropping because the prevalence of the virus is abating, or because people are vaccinated? You can't disentangle those sorts of things very easily when you just look at short time periods. Death rates for both vaccinated and unvaccinated dropped 3-fold in that month. Is that due to some trend related to some sort of evolving immunity issue as you claim? Or simply because there was less virus in circulation during May compared to April? The logical answer is the latter.nett wrote: ↑Tue Jul 19, 2022 2:44 pmThere is a trend forming, and it's going the wrong way. Specifically, it's going the direction that skeptical mRNA experts specifically warned about.Ken wrote: ↑Tue Jul 19, 2022 12:08 pmThat is why you should look at longer-term trends and larger population aggregates and not just one month. Especially if you are parsing the data into such small categories where random variation can affect results. I mean, sure, I would agree that for one month the data show that the non-boosted have a higher death rate. But we are talking about just 16 deaths which likely isn't a large enough sample size to have confidence about the results. And that is why the aggregate data posted previously is more informative. In fact the confidence limits between that number and the unvaccinated death rates overlap so statistically you can't reliably say that one is actually higher than the other.nett wrote: ↑Tue Jul 19, 2022 10:32 amLook at the data, and the trend for non-boosted. That is despite discarding the first 21 days after a dose. on a 6 month booster schedule, that's throwing out 9% of your sample. When you start making those kinds of compromises, you can make the data say whatever you want. but it's obvious what's going on.
I think the booster benefit can be explained with nothing but the 21 day exemption, although I can't find any data to prove that. A major reason I think that, is because the 21 data is intentionally not tracked, so I assume they're hiding something.
Would you agree with this statement. 2 dose vaccination (ie: non boosted) now has higher case rate, mortality, and hospitalization?
There is also the all-cause mortality concern that the UK is experiencing. Something is seriously wrong.
That is why the longer-term data provides a better picture.
0 x
A fool can throw out more questions than a wise man can answer. -RZehr
Re: Coronavirus Outbreak
The long term data is showing a trend of vaccine-preferring variants. Look at BA.5 and Australia. What long term are you looking at, that is so rosy? highly vaccinated countries are getting crushed. Meanwhile, I've gotten COVID exactly once, and people around me who are vaccinated seem to be getting it every few months.Ken wrote: ↑Tue Jul 19, 2022 3:50 pm Actually we are talking about a month (May 2022) in which COVID mortality was rapidly declining across the board in the UK because the spread of the Omicron variant was rapidly abating. This pandemic comes in waves or surges. And picking just one month when deaths across the board are rapidly dropping is not going to give you meaningful trends. In other words, are death rates dropping because the prevalence of the virus is abating, or because people are vaccinated? You can't disentangle those sorts of things very easily when you just look at short time periods. Death rates for both vaccinated and unvaccinated dropped 3-fold in that month. Is that due to some trend related to some sort of evolving immunity issue as you claim? Or simply because there was less virus in circulation during May compared to April? The logical answer is the latter.
That is why the longer-term data provides a better picture.
0 x
-
RZehr
Re: Coronavirus Outbreak
I had Covid twice in within 12 months in 2020; then got the J&J vaccine 6-7 months later, in 2021; and then tested positive again 8 months later in 2022.nett wrote: ↑Wed Jul 20, 2022 11:12 amThe long term data is showing a trend of vaccine-preferring variants. Look at BA.5 and Australia. What long term are you looking at, that is so rosy? highly vaccinated countries are getting crushed. Meanwhile, I've gotten COVID exactly once, and people around me who are vaccinated seem to be getting it every few months.Ken wrote: ↑Tue Jul 19, 2022 3:50 pm Actually we are talking about a month (May 2022) in which COVID mortality was rapidly declining across the board in the UK because the spread of the Omicron variant was rapidly abating. This pandemic comes in waves or surges. And picking just one month when deaths across the board are rapidly dropping is not going to give you meaningful trends. In other words, are death rates dropping because the prevalence of the virus is abating, or because people are vaccinated? You can't disentangle those sorts of things very easily when you just look at short time periods. Death rates for both vaccinated and unvaccinated dropped 3-fold in that month. Is that due to some trend related to some sort of evolving immunity issue as you claim? Or simply because there was less virus in circulation during May compared to April? The logical answer is the latter.
That is why the longer-term data provides a better picture.
In my experience there hasn’t been “immunity”, just declining levels of sickness. The first time I thought I was gonna die. The last time I barely felt bad, I just took the test to see, because I was curious.
0 x