Ken wrote: ↑Mon Jul 18, 2022 1:12 am
The graph I posted is no more fake than the one you posted. The different columns represented different population sizes, just like they did on your graph of Manitoba and the previous one from the UK.
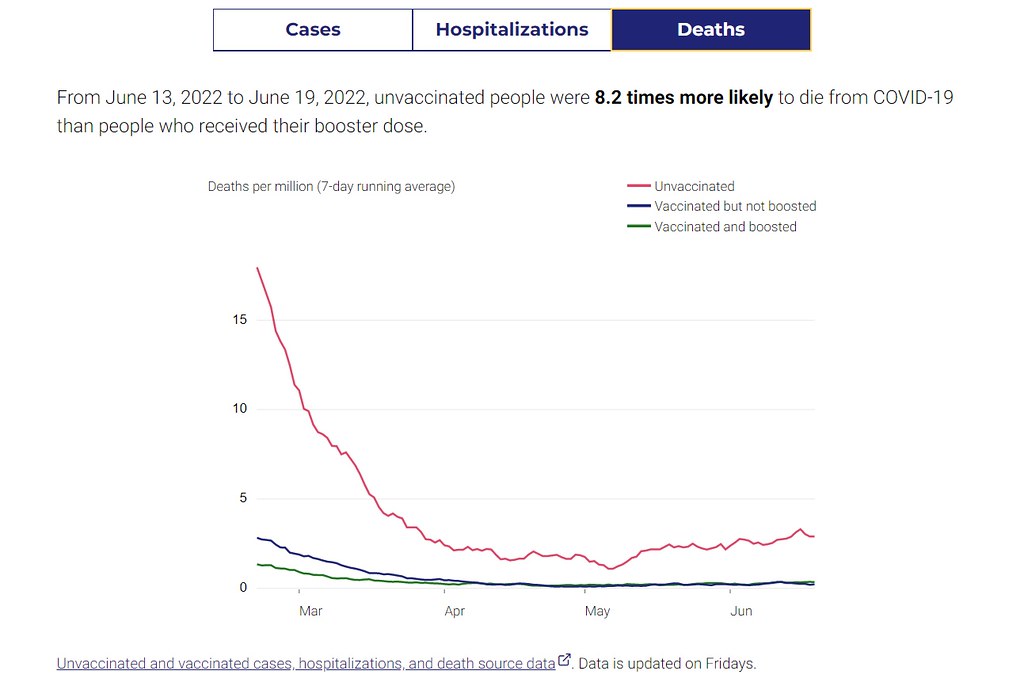
It does no good to post separate statistics for population sizes taken from different data sets because those numbers are constantly changing. If you want to legitimately calculate death rates for vaccinated and unvaccinated then you need to use data that draws from the same statistical population for both the numerator and the denominator. And preferably data that is stratified by age since death rates vary greatly by age as do vaccination rates.
Data from the US is not granular enough to actually figure anything out. A lot of pro-vaccine people are complaining about this. Your WA data is just not worth looking at until they provide more detail.
Europe and Canadian data is just a lot better tracked, probably because they ave centralized universal healthcare (yay!). Unfortunately European countries and Canada has removed tables and graphs from their reports, because it "could be used to spread misinformation", ie: they didn't like what it was showing.
Moving on, I have provided population percentages for every graph I posted, and I never mixed statistical populations. That is what the MdPH dashboard did, and I called that out. If you think I did this,
please reply with the post, and a detailed explanation of the populations I was mixing. I'm willing to admit if I was wrong. However, if you cannot do this,
please stop with the red herrings
Can we can actually look at the data now?
This graph is age-adjusted from Manitoba's own data

No matter how you slice Manitoba's data, hospitalization and deaths are WORSE for vaccinated people. Boosters have a
slight impact in hospitalization, and ICU admissions, but are still worse for deaths.
This is after ignoring the first 14 days after injection, which is when a lot of events occur.
If you don't want to accept this reality, that's fine, but please don't just lie about what I'm posting. This is the same statistical population, and it's age adjusted.