Stop trying to exclude non elderly from the statistical analysis then. Mandates have always included young people. And young people have a high risk of death from the vaccines (higher than their risk from COVID).Ken wrote: ↑Mon Jul 18, 2022 1:51 pmAs we discussed upstream, there are multiple public health reasons to become vaccinated, not just to avoid death. But yes, most countries did concentrate their initial vaccination efforts on the most vulnerable populations which are the elderly and immuno-compromised and then slowly expanded their efforts into the rest of the population. Not necessarily so much to reduce the death rates among the young, but to bring the pandemic to a faster end.Josh wrote: ↑Mon Jul 18, 2022 1:45 pmKen, this isn’t statistically valid, unless you want to make arguments solely for the elderly to be vaccinated.What this means is that for Canada, any analysis of the effectiveness of vaccines should probably concentrate on these populations, not the young.
In any case, can you stop calling people who disagree with you liars?
I am not calling you a liar. I am saying that most of the data you are presenting do not not actually support the claims that you are making. There is a difference. Are you doing it intentionally or just mistakenly?
Coronavirus Outbreak
-
Josh
Re: Coronavirus Outbreak
0 x
-
silentreader
Re: Coronavirus Outbreak
Going by the numbers and wording on Figure 7 and the wording on Figure 5 it appears that these 2 Figures are dealing with totals "as of..."Ken wrote: ↑Mon Jul 18, 2022 1:00 pmMy example of Ohio vs Vermont COVID deaths was calculated using the same exact methodology as both the UK and Manitoba data that Nett posted previously. They all show COVID deaths as a percentage of total deaths without regard for population size.Josh wrote: ↑Mon Jul 18, 2022 12:07 pm Ken,
I think you're coming very close to lying when you keep accusing nett of posting disjoint population statistics. I have not seen him do that at all.
I have refrained from calling you a liar so far since I have thought you have been arguing in good faith. But you need to halt your accusations of other people being liars and being intentionally dishonest. One could very easily conclude you have been doing the same thing.
None of these graphs are lying including mine. They all correctly reflect the data. But they are not a valid comparison of COVID interventions because they do not control for population size or show death rates per 100,000 population. Nett is not lying and I have not accused him of lying. What I have pointed out that none of the statistics that he has presented (until now) actually support the case that he is making. If he is an expert in statistics as he claims then he should know this.
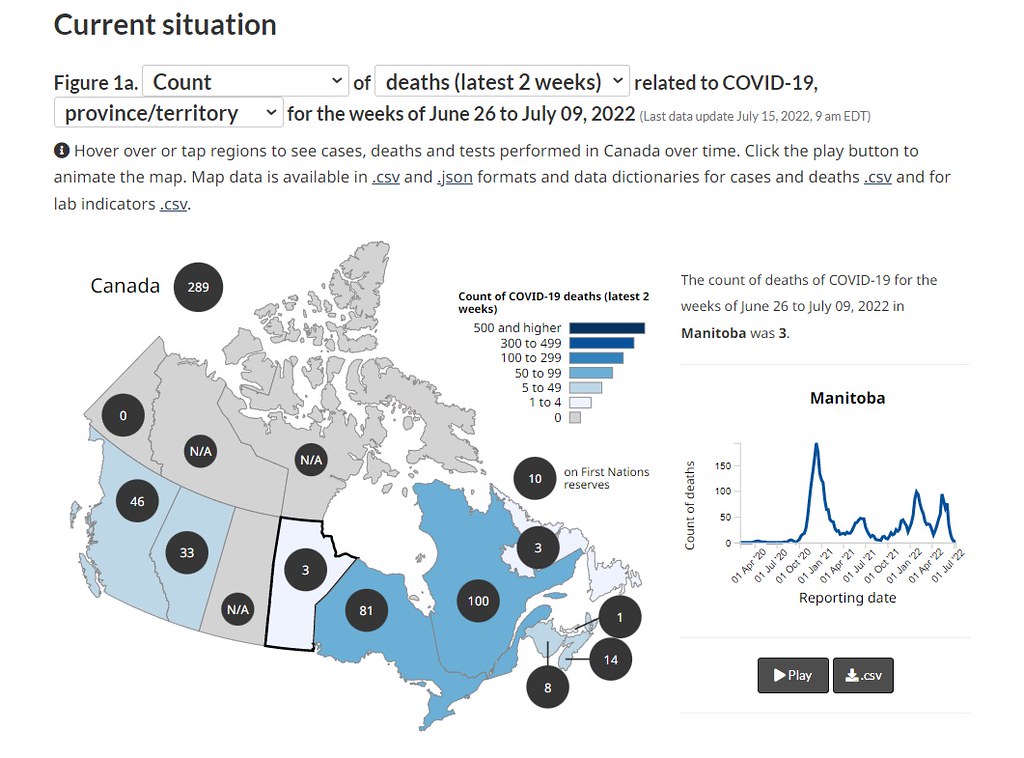
Today he has finally presented data showing COVID death rates for one month in Manitoba, which has a total population of 1.36 million or about the same population size as Maine or the Memphis metro area. Are these data accurate? I have no reason to believe that they aren't. Is one month of data from a population size so small a large enough sample size to use to draw conclusions about vaccines that have been distributed to billions of people worldwide? I have no idea but I doubt it. Are there quirks in the data that would explain such results? For example, do the vaccinated and unvaccinated populations differ in age, health, behavior, etc? I don't know. I did check the actual COVID data portal for CA which is here: https://health-infobase.canada.ca/covid-19/ and found that Manitoba only had 3 COVID deaths in the past 2 weeks so it isn't like they are currently in the midst of a huge outbreak. This is what the current COVID portal looks like for Canada. I doubt there is enough data coming out of Manitoba to draw much in the way of conclusions. You can see to the right a graph of COVID deaths over time in Manitoba. They had a short spike in May that lasted a week or two but that is it.
If we scroll down on the current COVID portal for Canada we find the following summary of COVID cases, hospitalizations, and deaths for all of Canada. I wonder why Nett didn't show us this data instead of just Manitoba in May? Any ideas?
If we scroll further down the page we come to this interesting figure which shows the current age distribution of COVID deaths in Canada. They are almost entirely the elderly. Older men over age 60 or 70 are the most common victims until you get over age 80 in which case women are the majority, probably because there are a lot more women over age 80 in the population than men. What this means is that for Canada, any analysis of the effectiveness of vaccines should probably concentrate on these populations, not the young. I expect that Manitoba's May 2022 spike was also mostly among the elderly.


So the percentages showing would include the time period before vaccinations began when 100% were unvaccinated. This is one reason why the percentages are skewed so high for unvaccinated and so low for vaccinated and boosted.
0 x
Re: Coronavirus Outbreak
Here's the original post, with some helpful accenting since you apparently can't read normal text.Ken wrote: ↑Mon Jul 18, 2022 1:49 pmThis is the data you presented for the UK for which you did not provide a link to the original source and you did not provide population sizes so that one can calculate actual death rates for the vaccinated and unvaccinated. It is presented in EXACTLY the same way as the graph I made showing the percentages of COVID deaths in Ohio and Vermontnett wrote: ↑Mon Jul 18, 2022 1:38 pm The UK is showing the same trends, I posted that data before.
Are you going to respond to this?nett wrote: ↑Mon Jul 18, 2022 12:01 pm Moving on, I have provided population percentages for every graph I posted, and I never mixed statistical populations. That is what the MdPH dashboard did, and I called that out. If you think I did this, please reply with the post, and a detailed explanation of the populations I was mixing. I'm willing to admit if I was wrong. However, if you cannot do this, please stop with the red herrings

0 x
-
Ken
- Posts: 21863
- Joined: Thu Jun 13, 2019 12:02 am
- Location: Washington State
- Affiliation: former MCUSA
Re: Coronavirus Outbreak
Figure 5 has total death numbers of about 19,000 which would only be about the last year of the pandemic or basically the time period in which vaccines were widely available. Figure 7 has total death numbers of about 42,000 so that would be consistent with cumulative data for the entire pandemic since it has killed about 42,000 in Canada since the beginning.silentreader wrote: ↑Mon Jul 18, 2022 2:10 pm Going by the numbers and wording on Figure 7 and the wording on Figure 5 it appears that these 2 Figures are dealing with totals "as of..."
So the percentages showing would include the time period before vaccinations began when 100% were unvaccinated. This is one reason why the percentages are skewed so high for unvaccinated and so low for vaccinated and boosted.
These are not my figures, I didn't make them. I just found them when digging into the Canadian data. I agree they are poorly labeled and the footnotes do not provide clarity.
0 x
A fool can throw out more questions than a wise man can answer. -RZehr
-
Ken
- Posts: 21863
- Joined: Thu Jun 13, 2019 12:02 am
- Location: Washington State
- Affiliation: former MCUSA
Re: Coronavirus Outbreak
Yes but your assertion that the UK is 75% vaccinated is based on what? It tells us nothing about the graph. I don't know where you got that data but it isn't from the same data from which the graph was produced. To actually calculate death rates you would need to know (1) how many total deaths were attributed to both the vaccinated and unvaccinated, and (2) how many people were vaccinated and unvaccinated during that same time period and for the same population in which the death statistics were derived. That way you could calculate death rates (deaths per 100,000 population) for each subgroup. Where is your data showing UK death RATES per 100,000 people for each category of vaccination status and better yet, for each age cohort?nett wrote: ↑Mon Jul 18, 2022 2:17 pmHere's the original post, with some helpful accenting since you apparently can't read normal text.Ken wrote: ↑Mon Jul 18, 2022 1:49 pmThis is the data you presented for the UK for which you did not provide a link to the original source and you did not provide population sizes so that one can calculate actual death rates for the vaccinated and unvaccinated. It is presented in EXACTLY the same way as the graph I made showing the percentages of COVID deaths in Ohio and Vermont
We know in fact that they are NOT the same data because your 75% figure is for FULLY VACCINATED (whatever that means today) while the graph you showed only says "vaccinated" and not "fully vaccinated" So if you are trying to apply your 75% figure to that graph you are comparing apples and oranges.
0 x
A fool can throw out more questions than a wise man can answer. -RZehr
-
silentreader
Re: Coronavirus Outbreak
Percentages are handy for making any kind of point it seems.Ken wrote: ↑Mon Jul 18, 2022 2:19 pmFigure 5 has total death numbers of about 19,000 which would only be about the last year of the pandemic or basically the time period in which vaccines were widely available. Figure 7 has total death numbers of about 42,000 so that would be consistent with cumulative data for the entire pandemic since it has killed about 42,000 in Canada since the beginning.silentreader wrote: ↑Mon Jul 18, 2022 2:10 pm Going by the numbers and wording on Figure 7 and the wording on Figure 5 it appears that these 2 Figures are dealing with totals "as of..."
So the percentages showing would include the time period before vaccinations began when 100% were unvaccinated. This is one reason why the percentages are skewed so high for unvaccinated and so low for vaccinated and boosted.
These are not my figures, I didn't make them. I just found them when digging into the Canadian data. I agree they are poorly labeled and the footnotes do not provide clarity.
And it only looks at 74.3% of the cases. That was around the time they started counting them differently. I'm not sure anymore what they all changed in their counting methods but I was tracking it at the time and the stats changed significantly over a period of several days.
When the Province of Ontario stopped publishing their "Cases by Vaccination Status" 5 days a week, (in April maybe?) the rates per 100,000 of new cases was almost even for non-vaccinated and those with 2 shots, while the rate per 100,000 for those with a booster was almost double either of the other two and had been consistently that for quite some time. But I have no way of proving that anymore.
0 x
Re: Coronavirus Outbreak
As is par for the course for COVID / Vaccine stats from official sources. There is a huge bureaucratic cost to any agency publishing data that questions vaccine efficacy.Ken wrote: ↑Mon Jul 18, 2022 2:19 pmFigure 5 has total death numbers of about 19,000 which would only be about the last year of the pandemic or basically the time period in which vaccines were widely available. Figure 7 has total death numbers of about 42,000 so that would be consistent with cumulative data for the entire pandemic since it has killed about 42,000 in Canada since the beginning.silentreader wrote: ↑Mon Jul 18, 2022 2:10 pm Going by the numbers and wording on Figure 7 and the wording on Figure 5 it appears that these 2 Figures are dealing with totals "as of..."
So the percentages showing would include the time period before vaccinations began when 100% were unvaccinated. This is one reason why the percentages are skewed so high for unvaccinated and so low for vaccinated and boosted.
These are not my figures, I didn't make them. I just found them when digging into the Canadian data. I agree they are poorly labeled and the footnotes do not provide clarity.
0 x
-
ohio jones
Re: Coronavirus Outbreak
It might be better to refrain from posting things that are unclear; all they do is escalate the argumentation.
0 x
Re: Coronavirus Outbreak
UK vaccination rates are widely published, I used the average rate for the time period April 1st to May 31s 2022 (as it says in the graph header). The source for the data in the graph is UK ONS, which is also easy to find.Ken wrote: ↑Mon Jul 18, 2022 2:29 pm
Yes but your assertion that the UK is 75% vaccinated is based on what? It tells us nothing about the graph. I don't know where you got that data but it isn't from the same data from which the graph was produced. To actually calculate death rates you would need to know (1) how many total deaths were attributed to both the vaccinated and unvaccinated, and (2) how many people were vaccinated and unvaccinated during that same time period and for the same population in which the death statistics were derived. That way you could calculate death rates (deaths per 100,000 population) for each subgroup. Where is your data showing UK death RATES per 100,000 people for each category of vaccination status and better yet, for each age cohort?
We know in fact that they are NOT the same data because your 75% figure is for FULLY VACCINATED (whatever that means today) while the graph you showed only says "vaccinated" and not "fully vaccinated" So if you are trying to apply your 75% figure to that graph you are comparing apples and oranges.
I did use "fully vaccinated" for my 75% figure. The "at least one dose" figure would be 79%, which would line up with the labeling in the graph. There is still a 15% discrepancy.
0 x
-
Ken
- Posts: 21863
- Joined: Thu Jun 13, 2019 12:02 am
- Location: Washington State
- Affiliation: former MCUSA
Re: Coronavirus Outbreak
Yes, the ONS web site is easy to find but it doesn't have the data or graph that you displayed. All they have is this: https://www.ons.gov.uk/peoplepopulation ... d31may2022nett wrote: ↑Mon Jul 18, 2022 3:43 pmUK vaccination rates are widely published, I used the average rate for the time period April 1st to May 31s 2022 (as it says in the graph header). The source for the data in the graph is UK ONS, which is also easy to find.Ken wrote: ↑Mon Jul 18, 2022 2:29 pm
Yes but your assertion that the UK is 75% vaccinated is based on what? It tells us nothing about the graph. I don't know where you got that data but it isn't from the same data from which the graph was produced. To actually calculate death rates you would need to know (1) how many total deaths were attributed to both the vaccinated and unvaccinated, and (2) how many people were vaccinated and unvaccinated during that same time period and for the same population in which the death statistics were derived. That way you could calculate death rates (deaths per 100,000 population) for each subgroup. Where is your data showing UK death RATES per 100,000 people for each category of vaccination status and better yet, for each age cohort?
We know in fact that they are NOT the same data because your 75% figure is for FULLY VACCINATED (whatever that means today) while the graph you showed only says "vaccinated" and not "fully vaccinated" So if you are trying to apply your 75% figure to that graph you are comparing apples and oranges.
I did use "fully vaccinated" for my 75% figure. The "at least one dose" figure would be 79%, which would line up with the labeling in the graph. There is still a 15% discrepancy.
Which only has links to a bunch of aggregated data for England (not the whole UK) and doesn't have any of the numbers or statistics that you presented.
0 x
A fool can throw out more questions than a wise man can answer. -RZehr