My example of Ohio vs Vermont COVID deaths was calculated using the same exact methodology as both the UK and Manitoba data that Nett posted previously. They all show COVID deaths as a percentage of total deaths without regard for population size.Josh wrote: ↑Mon Jul 18, 2022 12:07 pm Ken,
I think you're coming very close to lying when you keep accusing nett of posting disjoint population statistics. I have not seen him do that at all.
I have refrained from calling you a liar so far since I have thought you have been arguing in good faith. But you need to halt your accusations of other people being liars and being intentionally dishonest. One could very easily conclude you have been doing the same thing.
None of these graphs are lying including mine. They all correctly reflect the data. But they are not a valid comparison of COVID interventions because they do not control for population size or show death rates per 100,000 population. Nett is not lying and I have not accused him of lying. What I have pointed out that none of the statistics that he has presented (until now) actually support the case that he is making. If he is an expert in statistics as he claims then he should know this.
Today he has finally presented data showing COVID death rates for one month in Manitoba, which has a total population of 1.36 million or about the same population size as Maine or the Memphis metro area. Are these data accurate? I have no reason to believe that they aren't. Is one month of data from a population size so small a large enough sample size to use to draw conclusions about vaccines that have been distributed to billions of people worldwide? I have no idea but I doubt it. Are there quirks in the data that would explain such results? For example, do the vaccinated and unvaccinated populations differ in age, health, behavior, etc? I don't know. I did check the actual COVID data portal for CA which is here: https://health-infobase.canada.ca/covid-19/ and found that Manitoba only had 3 COVID deaths in the past 2 weeks so it isn't like they are currently in the midst of a huge outbreak. This is what the current COVID portal looks like for Canada. I doubt there is enough data coming out of Manitoba to draw much in the way of conclusions. You can see to the right a graph of COVID deaths over time in Manitoba. They had a short spike in May that lasted a week or two but that is it.
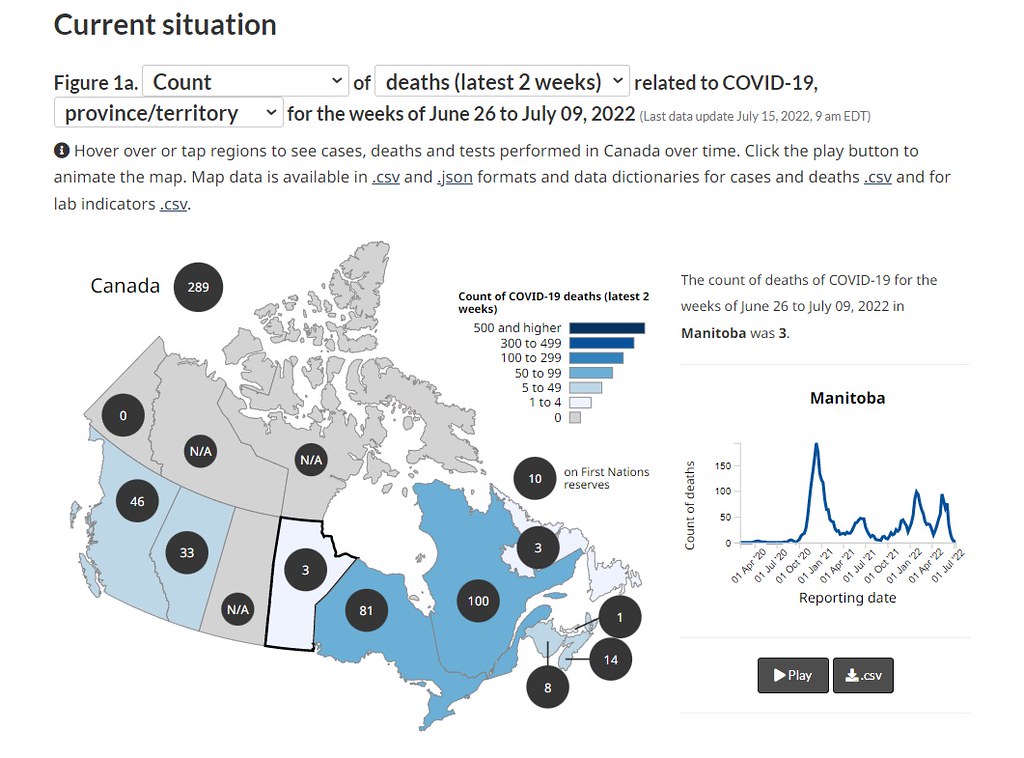
If we scroll down on the current COVID portal for Canada we find the following summary of COVID cases, hospitalizations, and deaths for all of Canada. I wonder why Nett didn't show us this data instead of just Manitoba in May? Any ideas?

If we scroll further down the page we come to this interesting figure which shows the current age distribution of COVID deaths in Canada. They are almost entirely the elderly. Older men over age 60 or 70 are the most common victims until you get over age 80 in which case women are the majority, probably because there are a lot more women over age 80 in the population than men. What this means is that for Canada, any analysis of the effectiveness of vaccines should probably concentrate on these populations, not the young. I expect that Manitoba's May 2022 spike was also mostly among the elderly.


